| Home > Software > WinCorsa Software Tour |
| WinCorsa Software Tour |
|---|
| The best way to understand
the software is to look at an example. The following screen shots
are from a drag-racing Mustang making a quarter-mile pass in about
eight seconds. Let’s see how much detail we can find in those
few seconds.
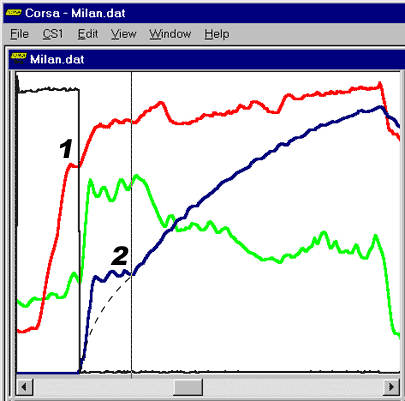
The graph shows engine RPM in red, driveshaft RPM in blue, and g's of acceleration in green. Time is on the X or horizontal axis. The thin black trace is the transmission brake. Label 1 shows where the trans brake is released. Notice the little plateau in the engine RPM just before this. The engine is on the rev limiter, and placing the cursor there would show us the exact RPM. After the trans brake is released the engine RPM climbs and the driveshaft RPM (blue line) immediately jumps up to about 2500 RPM. The tires are spinning. When using the WinCorsa software you can move the cursor over the data and a data box would show the exact reading for each sensor where the cursor is placed. These readings change as you move the cursor around the screen with the mouse.
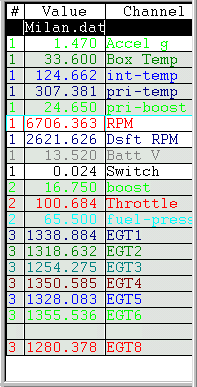
In this picture we have placed the cursor is placed at point 2 so we can read the exact values at this point in the right window. 2621 driveshaft RPM, 6706 engine RPM, and 1.47 g's of acceleration, to be exact. This point is where the tires finally hook up, and the driveshaft RPM begins to climb steadily as the car continues to accelerate. The difference between the actual driveshaft RPM trace and the dotted line we have drawn shows how long ,and how fast, the tires were spinning. We can follow the red trace further to the peak where the transmission shifts into second gear, we could check the exact shift RPM, and so on. The graphs continue past where the car is shut down near the right edge of the window.
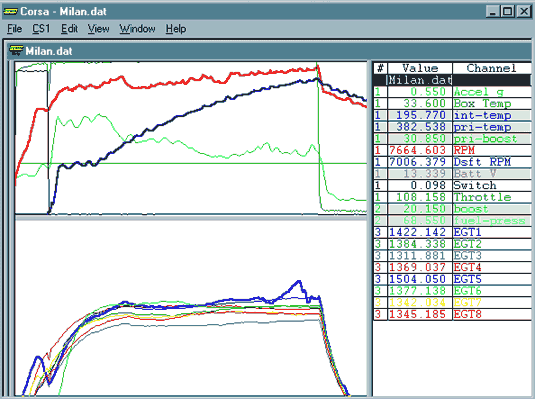
In this view we have added the lower window showing the eight exhaust gas temperature (EGT) readings, one for each cylinder. The Corsa software has complete flexibility about how each channel is displayed. This car has many pressure and temperature sensors which are not shown in this particular screen shot. You can see the names and values in the gray boxes at the right. Looking at the EGT readings we can see that after launch they all rise to nearly steady values. If the manifold and fuel system were perfect, they would be grouped very closely. This car shows about 100 degrees difference between the hottest and coldest on this pass. Also notice that EGT5 (shown in bold blue) spikes up near the end of the pass. Cylinder 5 was one of the hotter cylinders all along, and it suddenly gains another hundred degrees. Something has changed and that cylinder is leaning out. That's not good! The cursor is placed over the peak reading, and we can see the exact temperatures in the window to the right. Cylinder 5 is over 1500 while none of the others is over 1422 and the cooler cylinders are in the low 1300's. Time to work on that fuel system!
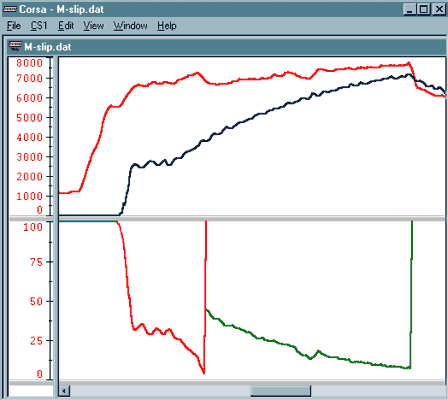
Here's another view with most of the channels hidden for simplicity. The optional WinCorsa Pro version allows you to set up any calculated channels you want. The traces in the lower window are torque converter slip, calculated from the difference between engine RPM and driveshaft RPM. The red trace is for first gear, with the gear ratio built into the calculation. The green trace is converter slip in top gear. The numbers along the left side of each window show the scale, from 0 to 8000 RPM and 0 to 100% slip in this case. We can get a good idea of the slip from this view, or we could use the cursor and the data boxes (not shown here) to pick off the exact values at any point of interest.
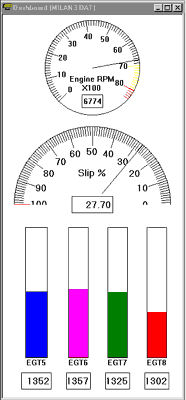
WinCorsa Pro also has an animated dashboard. You can set up gauges, indicators and alarm lights attached to any channels. As you move through the data file with the cursor, these gauges show the exact readings and how they change. This can make it easier to understand the data. We can't show an example of each WinCorsa feature in this quick tour, but this should give an idea how easy it is to view your racing data and gain some useful knowledge from the data to improve your performance. Wincorsa also includes:
|
